Week 25: Under the Weather with the Weather
Everybody seems to be talking about the weather these days, don't they? Well, global warming is indeed creeping up on us like a cloud of pollution or toxic fumes and people should be talking and doing something about it!
Anyway, in today's blog post I am going to be sharing with you two news articles that I found on the Internet. Pay close attention to the parts that I highlighted, since it is useful vocabulary to know about the topic!
The second article is about rising sea levels:
Here are the links I retrieved the information from:
Global warming: https://earthobservatory.nasa.gov/world-of-change/DecadalTemp
Rising sea levels: https://climate.nasa.gov/vital-signs/sea-level/
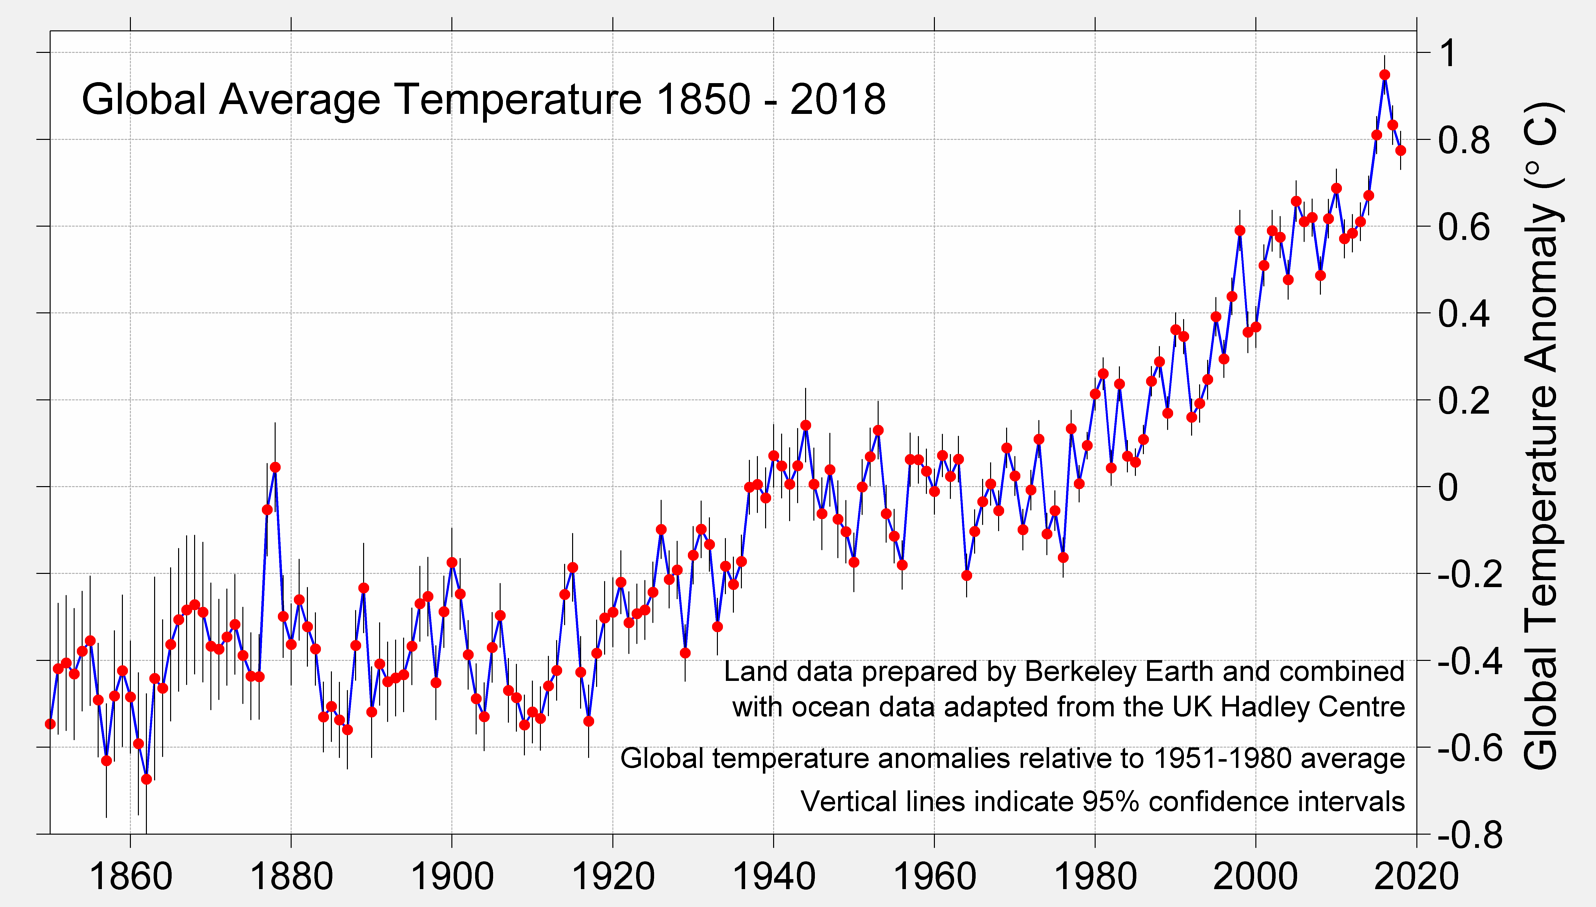
 Moreover, I found two charts that illustrate these two phenomena, global temperature (global warming) and sea levels. As one can observe, both charts indicate a rise in temperature and level of seawater, respectively. Whereas the first table's y-axis is measured by centigrade degrees , the second table's y-axis is measured in mm, or millimetres. The x-axis is similar for both charts. It measures the years in a 20-year sequence, or jumps. Both x-axes end with the year 2020, but they start at different years. The Sea Level chart starts to record information at the year 1880 whereas the Global Average Temperature chart starts 20 years earlier, at the year 1860.
Anyway, in today's blog post I am going to be sharing with you two news articles that I found on the Internet. Pay close attention to the parts that I highlighted, since it is useful vocabulary to know about the topic!
The world is getting warmer. Whether the cause is human activity or natural variability—and the preponderance of evidence says it’s humans—thermometer readings all around the world have risen steadily since the beginning of the Industrial Revolution. (Click on bullets above to step through the decades.)
According to an ongoing temperature analysis conducted by scientists at NASA’s Goddard Institute for Space Studies (GISS), the average global temperature on Earth has increased by about 0.8° Celsius (1.4° Fahrenheit) since 1880. Two-thirds of the warming has occurred since 1975, at a rate of roughly 0.15-0.20°C per decade.
But why should we care about one degree of warming? After all, the temperature fluctuates by many degrees every day where we live.
The global temperature record represents an average over the entire surface of the planet. The temperatures we experience locally and in short periods can fluctuate significantly due to predictable cyclical events (night and day, summer and winter) and hard-to-predict wind and precipitation patterns. But the global temperature mainly depends on how much energy the planet receives from the Sun and how much it radiates back into space—quantities that change very little. The amount of energy radiated by the Earth depends significantly on the chemical composition of the atmosphere, particularly the amount of heat-trapping greenhouse gases.
A one-degree global change is significant because it takes a vast amount of heat to warm all the oceans, atmosphere, and land by that much. In the past, a one- to two-degree drop was all it took to plunge the Earth into the Little Ice Age. A five-degree drop was enough to bury a large part of North America under a towering mass of ice 20,000 years ago.
The maps above show temperature anomalies, or changes, not absolute temperature. They depict how much various regions of the world have warmed or cooled when compared with a base period of 1951-1980. (The global mean surface air temperature for that period was estimated to be 14°C (57°F), with an uncertainty of several tenths of a degree.) In other words, the maps show how much warmer or colder a region is compared to the norm for that region from 1951-1980.
The line plot below shows yearly temperature anomalies from 1880 to 2014 as recorded by NASA, NOAA, the Japan Meteorological Agency, and the Met Office Hadley Centre (United Kingdom). Though there are minor variations from year to year, all four records show peaks and valleys in sync with each other. All show rapid warming in the past few decades, and all show the last decade as the warmest.
The second article is about rising sea levels:
Sea level rise is caused primarily by two factors related to global warming: the added water from melting ice sheets and glaciers and the expansion of seawater as it warms. The first graph tracks the change in sea level since 1993 as observed by satellites.
The second graph, derived from coastal tide gauge data, shows how much sea level changed from about 1870 to 2000. Data shown are latest available, given time needed to allow for processing.
Here are the links I retrieved the information from:
Global warming: https://earthobservatory.nasa.gov/world-of-change/DecadalTemp
Rising sea levels: https://climate.nasa.gov/vital-signs/sea-level/
...........

.......
This week, I have done once again what seems to be my preferred way to practice and improve my English: watch another movie! This time, my boyfriend took my -at first reluctant- self to watch Captain Marvel. The only reason I gave him a chance was because he convinced me that it was in the original version, English. I was plesantly surprised when I got out of the cinema because I found the movie to be really good, even though I am by no means a fan of Marvel, superheroes, or comics. I thorougly enjoyed myself, laughed a lot, and learned not to judge a book by its cover, because our prejudices are not absolute and they are not always right.
Comentarios
Publicar un comentario